When Should You Sell Your San Ramon Home?
Thinking about selling your San Ramon home but not sure when to make the move? You are not alone. Timing your sale can feel complex with rates shifting, inventory changing week to week, and family needs to juggle. In this guide, you will learn how San Ramon is performing right now, how seasonality and mortgage rates affect your net, and a simple framework to decide if you should sell now or wait. Let’s dive in.
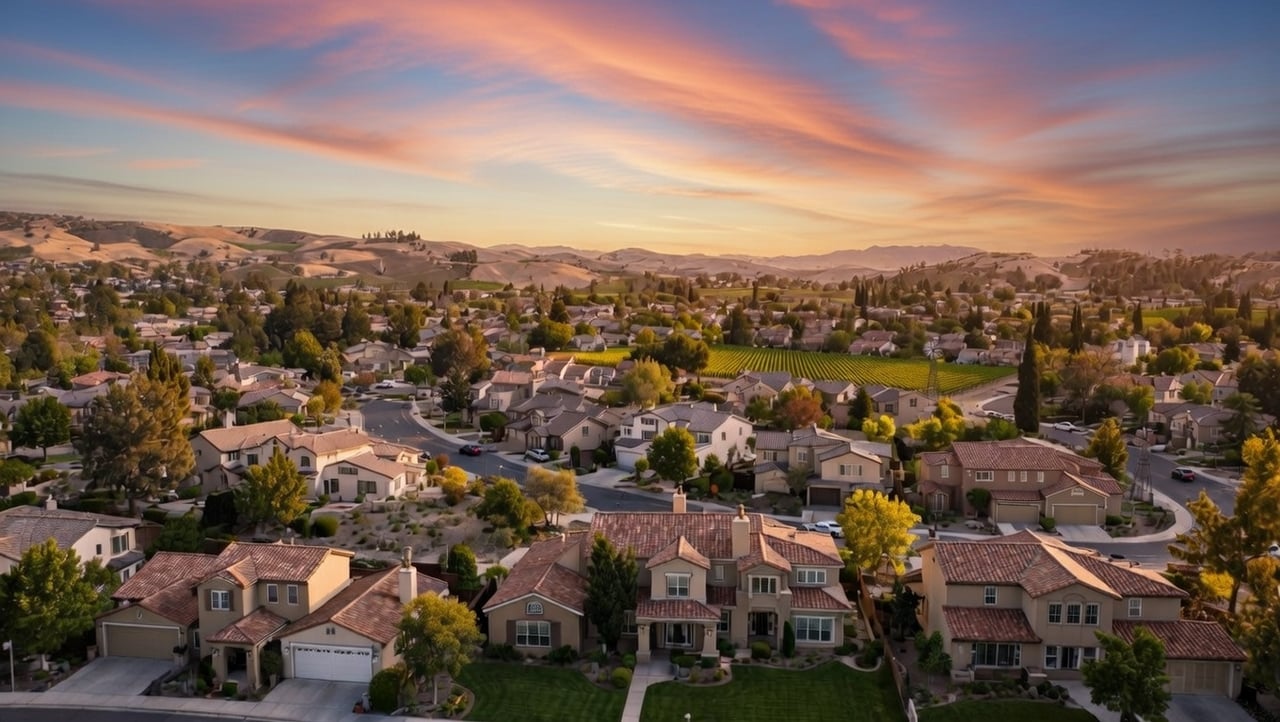
San Ramon remains a high‑price, active East Bay suburban market. Zillow’s typical home value index (ZHVI) shows 94582 around $1,703,430 and 94583 around $1,372,641, data through Dec 31, 2025. Use ZHVI as a general trend indicator rather than a list‑price target. See the ZHVI detail for 94582 in Zillow’s data tool for context and date notes on this page.
Sale price medians vary by data source and lookback window. Redfin reported a median sale price near $1.635M in 94582 in Dec 2025, which reflects recent closed sales in that ZIP and period per Redfin’s market page. Differences across providers are normal because each uses unique methods and timeframes.
Pace also differs by neighborhood and price band. A local market report noted very fast sales in some areas, with around 20 days on market in January 2026, while broader aggregator snapshots showed longer medians in specific ZIPs. The takeaway is that a well‑priced, move‑in‑ready home can still sell quickly, especially in the midrange bands, while luxury has longer timelines per this January 2026 writeup.
Inventory in the Tri‑Valley often sits in the seller‑leaning to balanced range. Many provider snapshots place months of inventory near 2 to 3 months, though it shifts by neighborhood and price tier. A move from about 2.0 to 3.5 months can change negotiating power, so watch your micro‑market weekly.
Seasonality still matters. National research finds that spring, and especially late May, often delivers a modest price premium and faster sales as buyers align moves with better weather and the school calendar. Zillow’s analysis highlights a late‑May edge for sellers based on historical listing performance in this study. San Ramon typically follows a similar pattern, with active spring demand and a quieter late summer.
What this means for you: If you can be ready for spring, especially late May, you can position your listing for stronger buyer traffic and better odds of multiple offers. If your timeline is fixed for another season, a tight local supply and great presentation can still deliver a strong result.
Mortgage rates influence both buyer demand and your own next purchase. The Freddie Mac 30‑year fixed average was about 6.09% for the week ending Feb 12, 2026 per this rate update. That is lower than late‑2024 peaks, which helps buyers. It is still meaningfully higher than pandemic lows, which affects move‑up math.
A simple payment example shows why this matters. A $500,000 mortgage at 3.00% is roughly $2,108 per month for principal and interest, while at 6.00% it is about $2,997. That is close to a $900 monthly difference for the same loan size. In San Ramon’s common move‑up price bands, the delta scales up and can shape affordability for you and for your buyers.
If you will buy after you sell, run numbers with a lender using current rates and note the as‑of date in your assumptions. Consider whether a rate dip window could help, but avoid waiting on predictions. Focus on the payment you can live with and the net you need from your sale.
Short term, weekly listing counts in your ZIP and neighborhood matter more than citywide averages. Track new listings, price reductions, and pending sales. You can get a quick pulse for 94582 listing activity and days on market from public snapshots on Realtor.com’s ZIP overview, then confirm with a local CMA.
Medium term, San Ramon’s Bishop Ranch area is undergoing redevelopment with for‑sale and rental housing that will roll out in phases across the next few years. Projects like City Village, CityWalk, and the Orchards will add inventory and options over time, which can influence market balance and buyer choices from 2026 through 2030. You can read about developer activity and phases on SummerHill Homes’ site. If your sale horizon is multi‑year, keep an eye on this pipeline.
Use three inputs to decide if you should list now or wait: your personal timeline, local market indicators, and financing options.
You do not need a full remodel to win in San Ramon. Focus on high‑ROI basics that make photos pop and show care.
Plan for typical selling costs when you estimate net proceeds. Combined listing and buyer‑agent commissions have historically landed near 5 to 6 percent in many markets, and typical escrow and closing fees can add about 1 to 2 percent. Total seller costs often fall in the 6 to 8 percent range, but local practices vary, so verify numbers for your property with this overview reference.
Also consider the federal principal residence gain exclusion. If you meet the ownership and use tests, you may exclude up to $250,000 of gain if single or up to $500,000 if married filing jointly. Review the rules in IRS Publication 523 and consult a tax professional for your situation on the IRS site.
If your home is in a popular San Ramon neighborhood and price band, and you can be market‑ready for spring, the data supports listing sooner rather than later. Late May often provides a seasonal lift, rates have eased from recent peaks as of mid‑February 2026, and months of inventory in many segments remains relatively lean. If you are a move‑up seller, run the payment math now and weigh bridge options so you can act when your micro‑market is tight and buyer traffic is high.
Want a property‑specific plan that blends timing, pricing, and light prep to maximize results? Get a custom strategy and on‑the‑ground data from the Tri‑Valley experts at Tom & Shannon Real Estate. We will review your goals, provide a precise CMA, and map the cleanest path from list to sold.

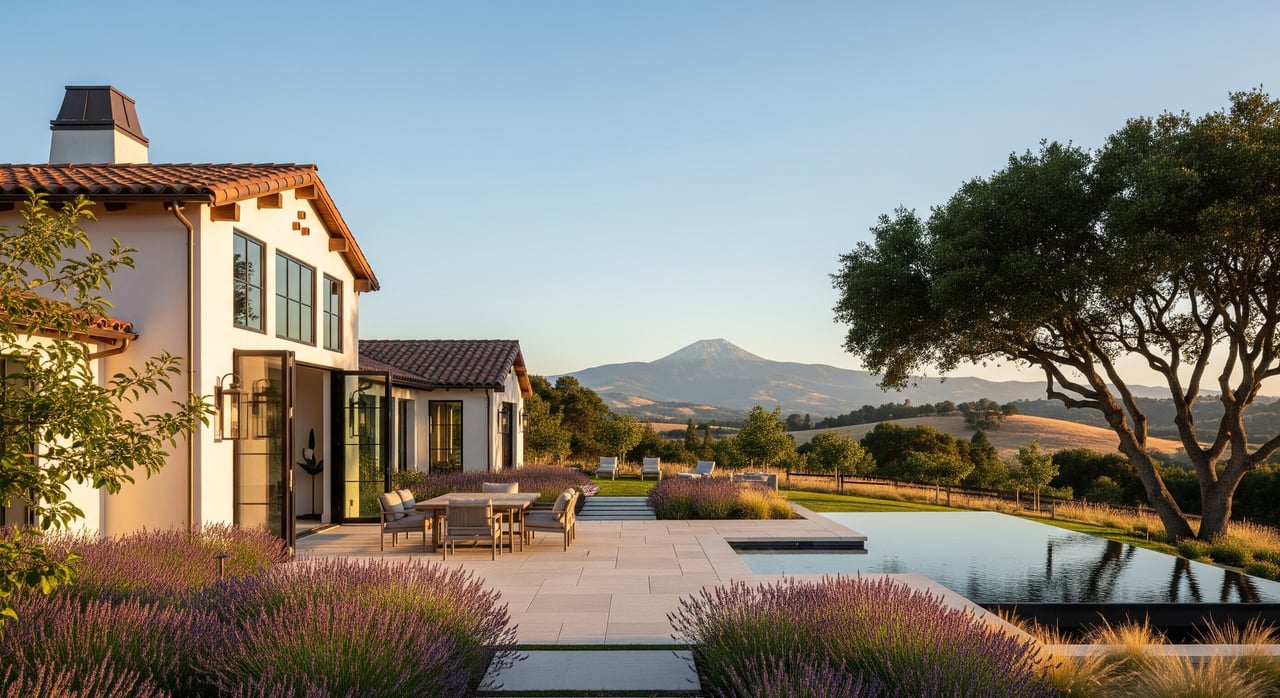
South Livermore Neighborhoods
Welcome to Livermore, California – where wine country charm meets family-friendly suburban living, all just a short drive from the Bay Area's tech hubs.
We pride ourselves in providing personalized solutions that bring our clients closer to their dream properties and enhance their long-term wealth.